Some people believe that life moves in circles. If its lessons are learned, then it goes up the spiral progressing upward. Recent discussions in Ukraine increasingly have it that Ukrainians have gone a full circle and found themselves back in the 1990s because they failed to learn the lessons of the early years of their independence. However, a closer analysis of statistics shows that today the nationwide average standard of living is significantly higher than 20 years ago. In fact, it often exceeds even the figures of the "stable and prosperous" Soviet period.
Solid reserves
Housing is arguably the most fundamental measure of material living standard. The housing stock in Ukraine as of 2015 totaled 974 million sq. m. This is 5.6% more than in 1990 (even with the losses from the annexation of Crimea and the occupation of a part of Donbas taken into account), and only 0.45% less than in 1995. The average number of square meters of housing available per one Ukrainian increased from 17.8 in 1990 to 18.9 in 1995 to 22.7 in 2015. The growth of the past two decades was 20%. The main quantitative factor here was the decline of Ukraine's population, but this should not be misleading. Over the two decades, about 170 million sq. m. of housing have been commissioned. This means that 15–20% of citizens have improved their living conditions by getting new, more comfortable homes.
In 2015, 11 million sq. m of housing were commissioned, which falls only slightly short of the record breaking 2013 (11.2 million sq. m.), even though in 2015 this housing was built under very different social and economic conditions compared to three years ago. This level is much higher than in 1995 (8.7 million sq.m.) or in the late 1990s (5.6 million sq.m.), but significantly lower than in the 1980s (17–20 million sq.m.). Generally, Ukraine today is much more prosperous than 20 years ago in terms of the residential space.
RELATED ARTICLE: What role privatization played in the rise of oligarchy
Importantly, the housing has improved both in terms of quantity and quality. Over the years of independence, Ukrainian families have massively renovated their homes. There is no statistics for it, but much is proven by the variety of wholesale and retail DIY stores and supermarkets that are now operating throughout the country, and the pace at which they have mushroomed over the past 10 years. This rapid growth is explained by the high demand. Forbes estimates the worth of the Gerega family, the owners of Epitsentr and Nova Liniya construction supply retail chains, at about $200 million. The turnover of these chains (the first and second largest networks in Ukraine by the number of supermarkets) is $1–2 billion. This leads to a rough estimate that the number of households annually renovating their homes has been hundreds of thousands, or even millions in the last 20 years.
In addition to renovations, the quality of the interior has improved dramatically. In 2014 (statistical surveys are carried out biannually, so the more recent data is not yet available), 100 households in Ukraine had 119 color TVs on average. In 2000, the first year of the survey, there were only 69 of them, and in 1990, apparently, even fewer. Two years ago, 37 out of 100 families had computers, 49 had microwave ovens, 16 had food processors, and each family had about two mobile phones (197 for 100 households), while in the 1990s, these benefits of civilization were not only unavailable to Ukrainians, but also unheard of. If since 2000 the average number of refrigerators per 100 households grew by 24, this means that about a quarter of Ukrainians started using them. About twice as many got new TVs.
The dynamics of car ownership is similar. As of 1990, the number of cars privately owned by Ukrainians amounted to 3.27 million. Five years later, their number rose to 4.47 million. According to the State Statistics Bureau, in 2011 this figure exceeded 6.5 million (no later data is available, but today this figure probably exceeds 7 million). And even though it is rather difficult to estimate what share of its car fleet Ukraine lost as a result of the annexation of Crimea and the occupation of Donbas, it is obvious that today Ukrainians have more cars than 20 years ago. This is easy to understand from the traffic intensity and the number of traffic jams in the cities. Many people would remember that fifteen years ago in Kyiv and 7–10 years ago in the largest oblast capitals the road congestion issue was virtually non-existent, because there were not so many cars. Today this is becoming a problem for a more and more cities. This is just another indicator of the growing material wealth. However, in this case it is combined with the deterioration of the environment and the general quality of public life (traffic noise, emissions, commuting problems, etc.), which also affect the living standards.
RELATED ARTICLE: Why the latest attempt to privatize Odesa Port Plant failed
The daily bread
The above figures clearly show that life in Ukraine today is better than 20 years ago. However, this statement requires two reservations. First of all, not everyone can afford to buy a new home or a new car, to do renovations or purchase major household appliances. This could mean that the life quality of the rich has indeed improved. But what about the poor? Secondly, most of these data refer to the stock generally accumulated prior to the Maidan and the war. Will the conclusions drawn from their analysis be confirmed by other data, such as indicators of regular consumption?
Let's start with food. According to the State Statistics Bureau, the consumption of fruit, berries and grapes in 1990 was 47 kg per capita, decreased to 33 kg within five years, and amounted to 51 kg in 2015. This is a clear step forward, which cannot be attributed to only the richer segments of the population. Two years after the revolution, this figure decreased by 5 kg per capita, or by nearly a tenth, but it is still significantly higher than two decades ago. The situation with vegetables and melons is similar: in 1990, Ukrainians bought 102 kg per capita per year, in 1995, 97 kg, and in 2015, 161 kg, with the consumption after the revolution remaining almost the same (163 kg in 2013–2014).
A similar pattern of consumption can be observed for meat and meat products: in 1990, it was 68kg per capita per year, in 1995, 39kg (many city residents will remember that in the "roaring nineties" not everyone could afford bread on the table every day, forget about meat), in 2015, 51 kg (with a decrease by 5 kg over the past two years). The meat consumption rates are also significantly higher than in the 1990s, even though they declined significantly during the crisis years of 2014–2016. A significant share of meat products on the domestic market is produced in Ukraine, so in order to assess the level of the population impoverishment, the consumption of fish and fish products, the lion's share of which is imported, will be more telling. Thus, in 1990s Ukrainians bought 17.5 kg of fish and fish products annually (oh, the cheap Soviet fish for any taste!), in 1995, 3.6 kg, in 2013, 14.6 kg, and last year, just 9.0 kg (or 38% less). The dynamics of seafood consumption, as can be seen from the statistics, are the most sensitive to economic crises and provide the best indicator of their depth. So, today Ukraine is still very far from the 1990s. However, we can be sure that if the economic declines continues for two or three years at the rate of 2015 (which will only be possible in case of an escalation of hostilities), fish products consumption at the level of 1995 may become entirely possible.
RELATED ARTICLE: How the balance of Ukraine's imports and exports changed over the past 2.5 years
If we analyze the consumption distribution of various food groups by income levels, we will see that both the poorest and the richest Ukrainians have been buying fewer fruit, fish and meat over the past two years: the reduction of the relevant indicators was characteristic of all five quintile groups by income levels: from 20% of the poorest to 20% of the richest. That is, it cannot be said that consumption declined only among the poorest. So, both the poor and the rich are equally far away from the 1990s.
Someone might be surprised, but crisis savings and reduced consumption affected food purchases even more than those of clothes. According to the State Statistics Service, in 2014–2015, compared to 2013, resulting consumption expenditure of households decreased by 32.6% in fixed prices for food and non-alcoholic beverages, and only by 13.5% for clothing and footwear. One would conclude that today people eat and drink slightly over 30% less than two and a half years ago, but it's not quite right. In reality, people are most likely buying less expensive food, especially imported products. This has a high impact on the overall statistics.
The indicative factors
A number of alternative indicators complement the picture. According to the data of Kyiv International Institute of Sociology, as of the beginning of 2016, 62% of the adult population of Ukraine used the Internet, and among the people aged 18–39, this share amounted to 91%. Two decades ago, the coverage of the "global web" in Ukraine was less than 1%. A question arises: is Internet is a luxury or a means of communication? It is most probably the latter, judging from the fact that in 2013 it was used by only 49% of citizens, while over two years this share increased by 13 percentage points. That is, despite the economic crisis, Ukrainians don't slow down on the consumption of communication services, and this obviously applies to both the poor and the rich. The dynamics of the growing Internet penetration make us conclude that the standard of living in the country kept increasing even after the revolution.
RELATED ARTICLE: Aircraft building in Ukraine: looking for a new niche
Another indicator is money transfers from those working abroad. This phenomenon has many aspects, both social and economic. However, two of them are the most obvious. First, migrant workers today earn a lot of money, ensuring rather high living standards for their families in Ukraine. According to NBU, while in 2000 money transfers from abroad totaled $61 million, in the last 5–10 years they amounted to $1.2 billion (depending on how we account for the informal channels of money transfer). This is a considerable replenishment for the budgets of hundreds of thousands of Ukrainian families and the pockets of millions of Ukrainians. Secondly, the very fact of the existence of several million migrant workers suggests that traveling outside of the country has become significantly easier. This is also a component of a better life. According to the State Statistics Service, in 2015 the number of citizens of Ukraine who have been abroad exceeded 23 million. Many of them traveled on holiday, while 20 years ago only a handful of people could afford this (unfortunately, there is no statistical data available), both due to the difficult financial situation and the serious barriers to crossing the border.
Poverty from tariffs?
Finally, perhaps the most socially significant indicator today is the standards of living vs. the costs of housing and communal services. According to the State Statistics Service, in 2014–2015, average prices for housing, water, electricity, gas and other fuels rocketed by 151%, and significantly increased in 2016 as well. At the same time, inflation in the previous two years was 66.7%, that is, utility tariffs increased at a rate twice and a half higher than any other prices in the country in general. The issue of prices for housing and utilities today is especially pressing. It sparks a debate about Ukraine returning back to the "impoverished nineties." But is there any real reason to believe this?
Natural gas price for households has increased the most. The universal rate of it today is UAH6,879 per 1,000 cubic meters. Three years ago it varied for various categories of consumers within the range of UAH725.4–2,954.1 per 1,000 cubic meters, i.e., there was a 2–10 times increase over the past 2+ years. Is this a lot? According to the State Statistics Bureau, the average monthly salary in Ukraine in the first half of 2016 was UAH4,838, and the average pension as of the beginning of this year was UAH1,699. This means that with today's salary, one can buy 703 cubic meters of natural gas, or 247 cubic meters with the average pension.
RELATED ARTICLE: The role and state of small and micro business in Ukraine
What was the situation 20 years ago? In 1995, average salary was UAH73, and average pension was UAH11.56 (since the hryvnia was only introduced in 1996, the available data has been converted to hryvnias). However, these figures often existed only on paper: all of us can remember significant arrears of salaries and pensions that were carried forward from year to year in the 1990s and were not repaid until the turn of the century, at least some of them. As for the cost of gas, on February 17, 1995, the instruction of the Economy Ministry set the tariffs at the level of 2.8–4.7 kopecks per cubic meter for various consumer categories, then on May 19 they were increased to 4–7 kopecks, then there was another increase, and at the beginning of 1996 the price of gas was set at the level of 6–11.5 kopecks. In this way, in 1995 one could buy 635–2,874 cubic meters of gas with the average salary, and 101–413 cubic meters with the average pension. However, the above amounts could only exist on paper, since due to inflation, which was still significant in 1995, salaries and pensions as of the beginning of that year were still considerably lower than the annual average, while the tariff increase rates over that year exceeded the income growth rate.
We can draw a conclusion that two decades ago, the purchasing power of wages measured in cubic meters of natural gas for residential use was the same or slightly higher than today. This is due to the fact that over two decades, the incomes of Ukrainians have increased so that they cover the manifold hike in gas prices needed to bring them to the economically justified market level. However, the purchasing power of pensions in 1995 was on average even lower than today, which is due to their very low level at that time in proportion to salaries. So, the retirees, to whom populist politicians often appeal speaking about high utility tariffs, today live not any worse than in the 1990s. And since the state is giving out subsidies right and left, today's situation with the tariffs is probably worse compared to the early 2000s, but not to the mid-1990s. Meanwhile, man does not live by gas alone. Other factors of progress now available and mentioned above far override the inconveniences related to utility tariffs. Even taking into account the protracted economic crisis of 2014–2016, Ukrainians today live better than they did 20 years ago by the manifest majority of material wealth indicators. This probably applies to all categories of population.
RELATED ARTICLE: How oligarchy rose in Ukraine and ways to overcome it
Noneconomic factors
The latter conclusion is further confirmed by several other factors. Two of them provide an integral estimate of the standard of living. The first one is the average life expectancy at birth. Last year it was 71.38 years, which is 1.4% higher than in 1990 and 6.9% higher than the minimum recorded in 1995.
As a matter of fact, average life expectancy is an indicator that encompasses everything. It is affected by such factors as the number of fatalities among miners, controllability of diseases such as tuberculosis or HIV/AIDS, crime rate, which increases as the living standards decline, performance of the economy, which determines income levels, social welfare of pensioners, which depends on the development level of the state machine, and much more. So, even the slightest increase in average life expectancy may be an indicator of a real revolution in some areas in the country, such as public administration or public health. And these are the components of the quality of life, which determine it if not directly, then indirectly.
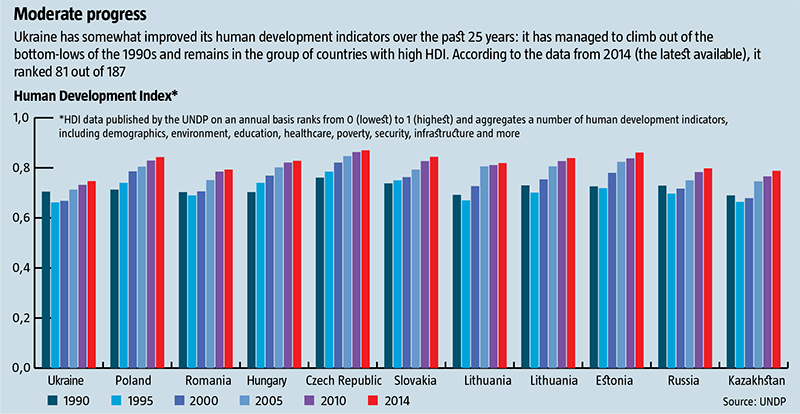
Another factor is the Human Development Index (HDI) determined by the United Nations Development Programme (see Moderate progress). It consists of 12 subindexes that take into account demographic, environmental, economic, and other aspects. According to this indicator, as of 2014 (there is no later data available) we were still dragging behind almost all other neighboring countries, but are now placed significantly higher than in 1990 or 1995. Even if we assume that in 2015–2016 the HDI value will be lower because of the war and the economic crisis, still we went a long way since the 1990s. If we look at the Balkan countries that suffered from war in the last decade of the 20th century, we can see that we would not fall below the 1990 level from the level of 2014, even if the conflict lingers for five years or goes into an active stage.
A clear majority of the above indicators of the standard of living are much better today than 20 years ago, and often also higher than at the beginning of the independence. That is, despite the lingering economic crisis of the recent years, talking about returning to the 1990s would be too wrong and too premature. Clearly, many people have already erased from their memory the problems and difficulties of that period, while the rather sharp drop in the living standards over the past two years catches the eye and thought almost every day. But objectively, if the entire period of independence is taken as a yardstick of comparison, the living standards of Ukrainians are not as bad as many say.
Translated by Lidia Wolanskyj
Follow us at @OfficeWeek on Twitter and The Ukrainian Week on Facebook